| |||||||||||||||||||||||||||||||||||||||||||||||||||||||||||||||||||||||||||||||||||||||||||||||||||||||||||||||||||||||||||||||||||||||||||||||||||||||||||||||||||||||||||||||||||||||||||||||||||||||||||||||||||||||||||||||||||||||||||||||||||||||||||||||||||||||||||||||||||||||||||||||||||||||||||||||||||||||||||||||||||||||||||||||||||||||||||||||||||||||||||

AI assistants · Nov 2025 to Oct 2026
113.8 million people
opened an AI assistant
this month.
Up from 82.6 million last year. Agents studied: ChatGPT, Gemini, Claude, Copilot, Grok, and Perplexity.
| |||||||||||||||||||||||||||||||||||||||||||||||||||||||||||||||||||||||||||||||||||||||||||||||||||||||||||||||||||||||||||||||||||||||||||||||||||||||||||||||||||||||||||||||||||||||||||||||||||||||||||||||||||||||||||||||||||||||||||||||||||||||||||||||||||||||||||||||||||||||||||||||||||||||||||||||||||||||||||||||||||||||||||||||||||||||||||||||||||||||||||
|
Twelve months
AI adoption is growing.
Average time spent: 32 minutes per day.
31.2 million more people than last November. October to date, shown as a full month at this pace.
On a day they use AI, they spend 31.8 minutes. That is about 4.6 opens of 7 minutes each, not one long sitting. They also use it on more days: 11.4 days last November, and 12.9 days in October to date. In March, a lot of people moved from ChatGPT to Claude and Gemini. Growth slowed that month. Most months since then, the number of people grew again. | |||||||||||||||||||||||||||||||||||||||||||||||||||||||||||||||||||||||||||||||||||||||||||||||||||||||||||||||||||||||||||||||||||||||||||||||||||||||||||||||||||||||||||||||||||||||||||||||||||||||||||||||||||||||||||||||||||||||||||||||||||||||||||||||||||||||||||||||||||||||||||||||||||||||||||||||||||||||||||||||||||||||||||||||||||||||||||||||||||||||||||
|
The assistants
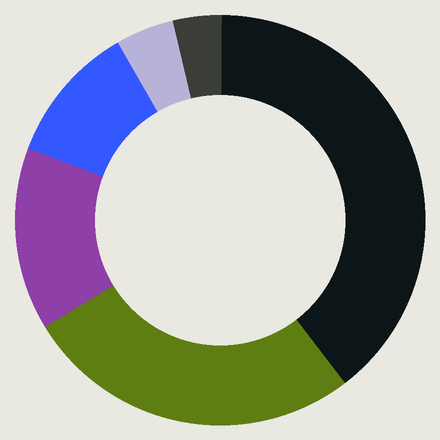
ChatGPT is the most used agent.
Over the full year.
One person can open more than one. This is each assistant's share of those openings over the full year.
| |||||||||||||||||||||||||||||||||||||||||||||||||||||||||||||||||||||||||||||||||||||||||||||||||||||||||||||||||||||||||||||||||||||||||||||||||||||||||||||||||||||||||||||||||||||||||||||||||||||||||||||||||||||||||||||||||||||||||||||||||||||||||||||||||||||||||||||||||||||||||||||||||||||||||||||||||||||||||||||||||||||||||||||||||||||||||||||||||||||||||||
|
How long
Duration: 30 - 60 minutes
on average.
91.5% of days end within an hour.
| |||||||||||||||||||||||||||||||||||||||||||||||||||||||||||||||||||||||||||||||||||||||||||||||||||||||||||||||||||||||||||||||||||||||||||||||||||||||||||||||||||||||||||||||||||||||||||||||||||||||||||||||||||||||||||||||||||||||||||||||||||||||||||||||||||||||||||||||||||||||||||||||||||||||||||||||||||||||||||||||||||||||||||||||||||||||||||||||||||||||||||
|
Time of day
10am to 4pm holds the most time.
Night grew. Morning stayed level.
Share of the minutes, November through October. Each line is one part of the day. 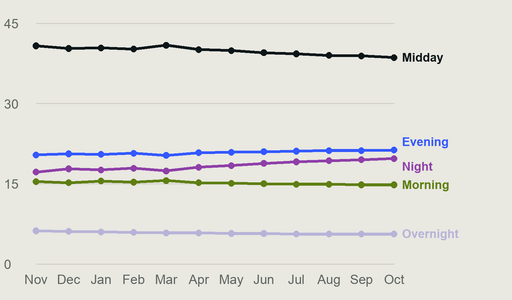
October to date.
8pm to midnight rose from 17.2% in November to 19.7% in October. Morning went from 15.4% to 14.8%. After midnight went from 6.2% to 5.6%. The workday eased from 40.8% to 38.6% and is still the biggest block every month. | |||||||||||||||||||||||||||||||||||||||||||||||||||||||||||||||||||||||||||||||||||||||||||||||||||||||||||||||||||||||||||||||||||||||||||||||||||||||||||||||||||||||||||||||||||||||||||||||||||||||||||||||||||||||||||||||||||||||||||||||||||||||||||||||||||||||||||||||||||||||||||||||||||||||||||||||||||||||||||||||||||||||||||||||||||||||||||||||||||||||||||
|
Before and after
They come from a search engine.
Most do not go back.
Where they were just before they opened AI, and the first place they went after. The first number is before. The second is after.
21.4% were on a traditional search engine just before. Only 13.2% go back to one after. Social does the opposite. 14.3% come from a feed. 17.9% go to a feed after. After 8pm, 29.4% go to a feed next. What they're asking
Block size is the share of questions.
Most questions are everyday tasks. Coding is 4.8%, and those sessions run long. The news is 4.4%. Shopping is 4.1%. A conversation is 3.9%. Schoolwork shows up at night and on Sundays. | |||||||||||||||||||||||||||||||||||||||||||||||||||||||||||||||||||||||||||||||||||||||||||||||||||||||||||||||||||||||||||||||||||||||||||||||||||||||||||||||||||||||||||||||||||||||||||||||||||||||||||||||||||||||||||||||||||||||||||||||||||||||||||||||||||||||||||||||||||||||||||||||||||||||||||||||||||||||||||||||||||||||||||||||||||||||||||||||||||||||||||
|
Commerce
AI agent, then traditional search.
Then ecommerce.
Few people open an AI agent to shop. When they do buy, most leave for traditional search first.
5.9% came from a store. 4.1% asked about shopping. | |||||||||||||||||||||||||||||||||||||||||||||||||||||||||||||||||||||||||||||||||||||||||||||||||||||||||||||||||||||||||||||||||||||||||||||||||||||||||||||||||||||||||||||||||||||||||||||||||||||||||||||||||||||||||||||||||||||||||||||||||||||||||||||||||||||||||||||||||||||||||||||||||||||||||||||||||||||||||||||||||||||||||||||||||||||||||||||||||||||||||||

Social
Social time went up.
Its share of the day went down.
People spent more time on social than last November. Social is a smaller share of the online day, 21.9% then and 21.6% now, because more of the day is in an assistant. Assistants went from 0.43% of the day to 0.60%. Some of that used to happen in a feed: the news, a recipe, or a conversation. The light dot is last November. The colored dot is October to date.
| |||||||||||||||||||||||||||||||||||||||||||||||||||||||||||||||||||||||||||||||||||||||||||||||||||||||||||||||||||||||||||||||||||||||||||||||||||||||||||||||||||||||||||||||||||||||||||||||||||||||||||||||||||||||||||||||||||||||||||||||||||||||||||||||||||||||||||||||||||||||||||||||||||||||||||||||||||||||||||||||||||||||||||||||||||||||||||||||||||||||||||
|
8.5% of AI users stay an hour or more in a day.
Those 9.7 million people are responsible for 36% of all the time spent on AI. | |||||||||||||||||||||||||||||||||||||||||||||||||||||||||||||||||||||||||||||||||||||||||||||||||||||||||||||||||||||||||||||||||||||||||||||||||||||||||||||||||||||||||||||||||||||||||||||||||||||||||||||||||||||||||||||||||||||||||||||||||||||||||||||||||||||||||||||||||||||||||||||||||||||||||||||||||||||||||||||||||||||||||||||||||||||||||||||||||||||||||||
| |||||||||||||||||||||||||||||||||||||||||||||||||||||||||||||||||||||||||||||||||||||||||||||||||||||||||||||||||||||||||||||||||||||||||||||||||||||||||||||||||||||||||||||||||||||||||||||||||||||||||||||||||||||||||||||||||||||||||||||||||||||||||||||||||||||||||||||||||||||||||||||||||||||||||||||||||||||||||||||||||||||||||||||||||||||||||||||||||||||||||||

Behavioral Intelligence Engine
Crosswalk, 23465 Civic Center Way Bldg 9, Malibu, CA 90265 | |||||||||||||||||||||||||||||||||||||||||||||||||||||||||||||||||||||||||||||||||||||||||||||||||||||||||||||||||||||||||||||||||||||||||||||||||||||||||||||||||||||||||||||||||||||||||||||||||||||||||||||||||||||||||||||||||||||||||||||||||||||||||||||||||||||||||||||||||||||||||||||||||||||||||||||||||||||||||||||||||||||||||||||||||||||||||||||||||||||||||||