3.7M streaming accounts had a second screen open during Falcons at Saints. Here is what they did.
Crosswalk. The Read, Oct 2026
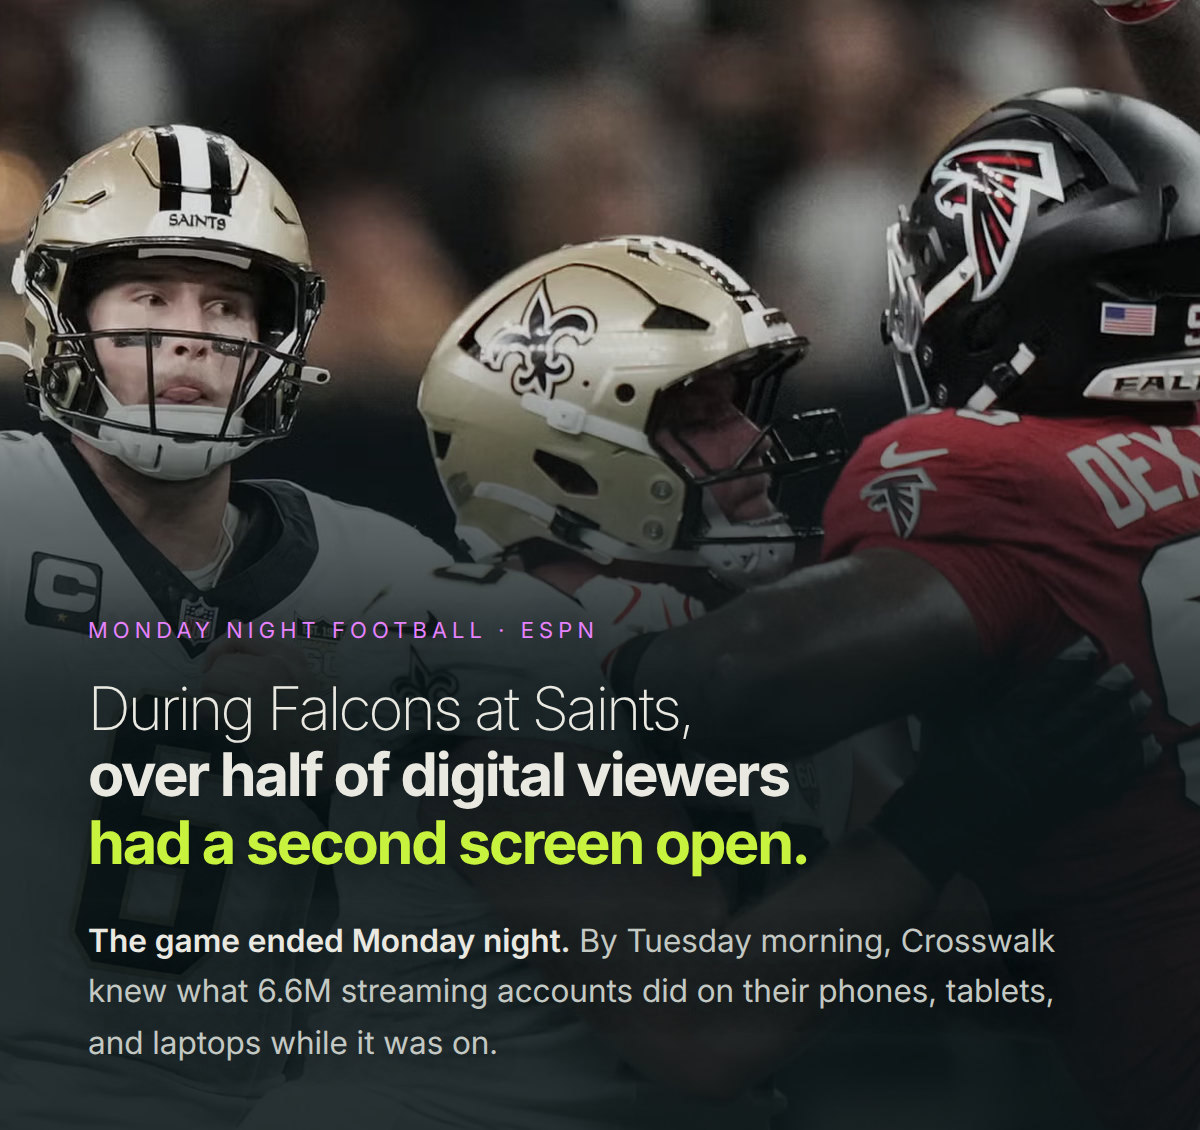
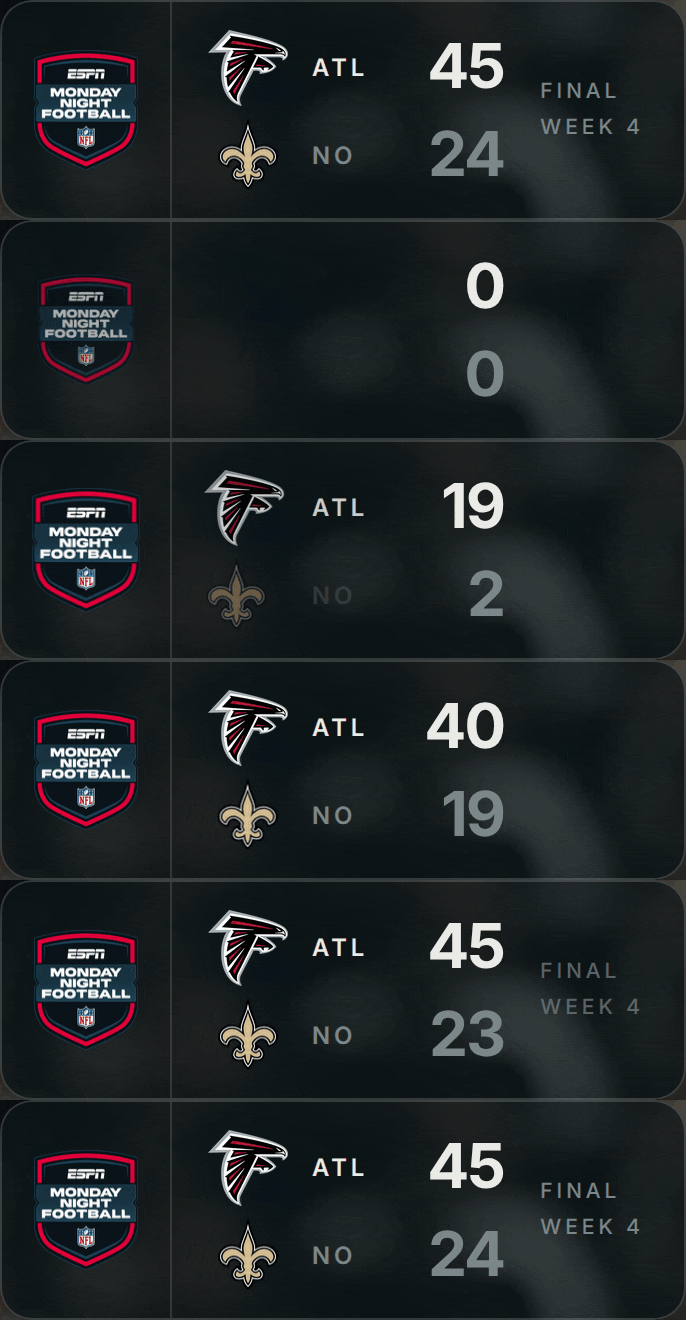
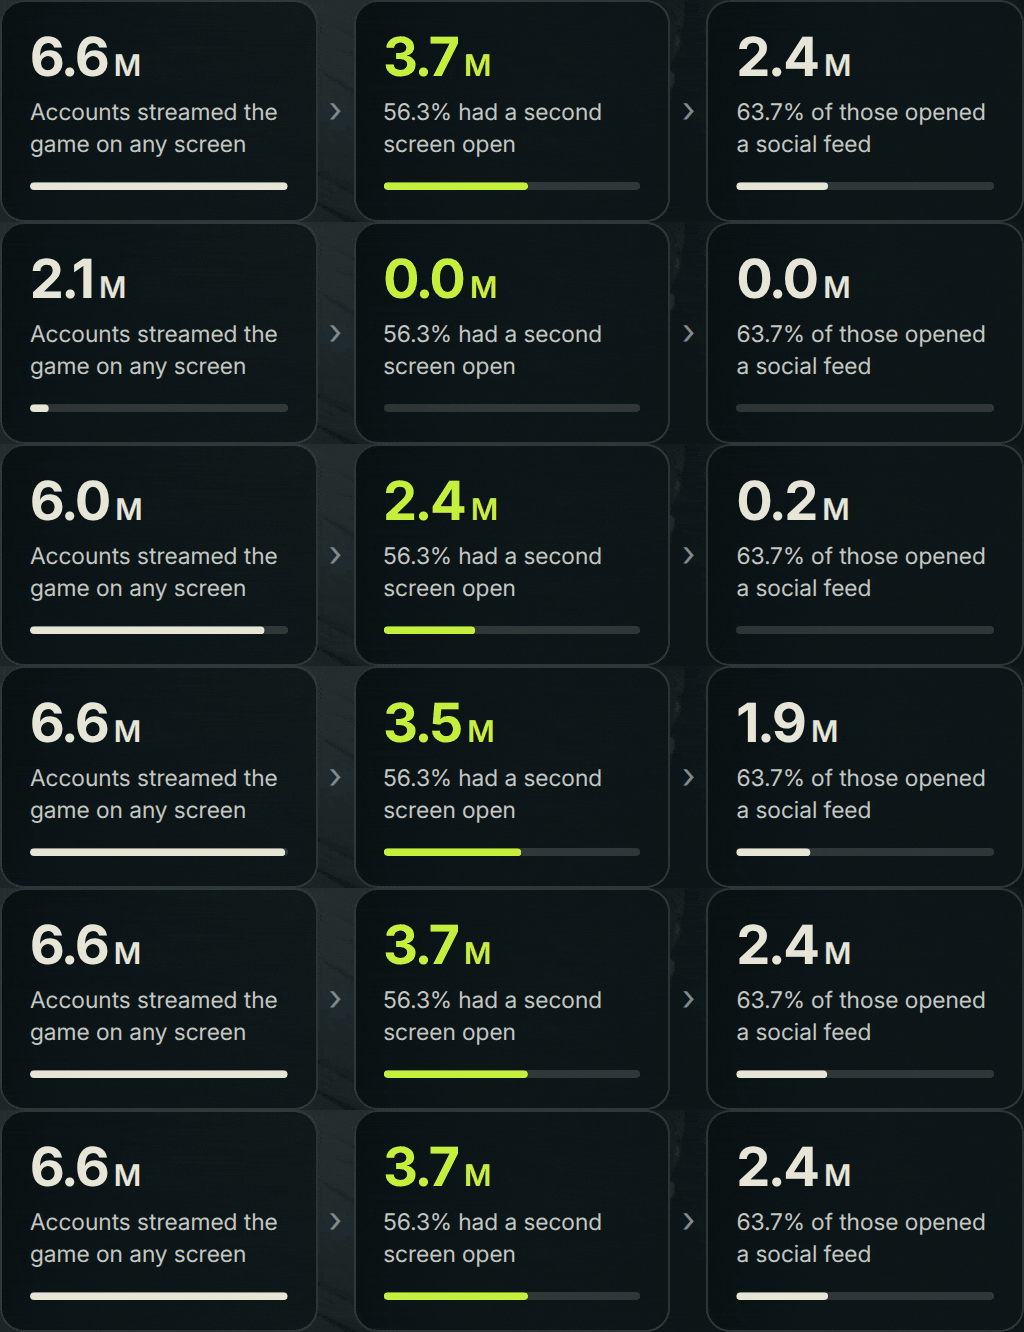
ATL 45 NO 24 FINAL WEEK 4 MONDAY NIGHT FOOTBALL · ESPN During Falcons at Saints, over half of digital viewers had a second screen open. The game ended Monday night. By Tuesday morning, Crosswalk knew what 6.6M streaming accounts did on their phones, tablets, and laptops while it was on. 6.6M Accounts streamed the game on any screen › 3.7M 56.3% had a second screen open › 2.4M 63.7% of those opened a social feed
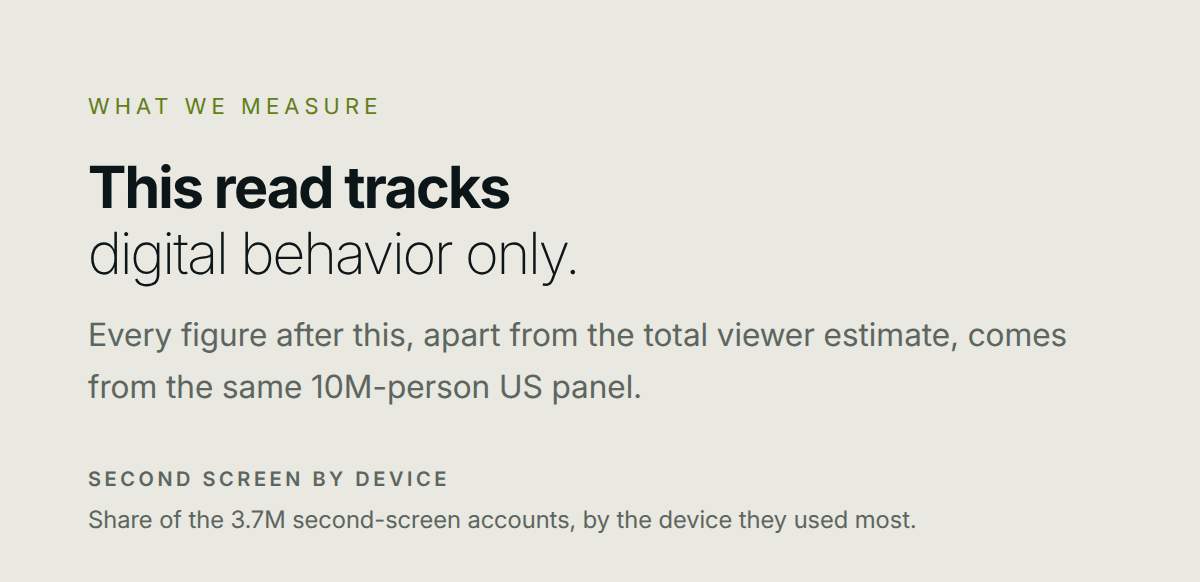
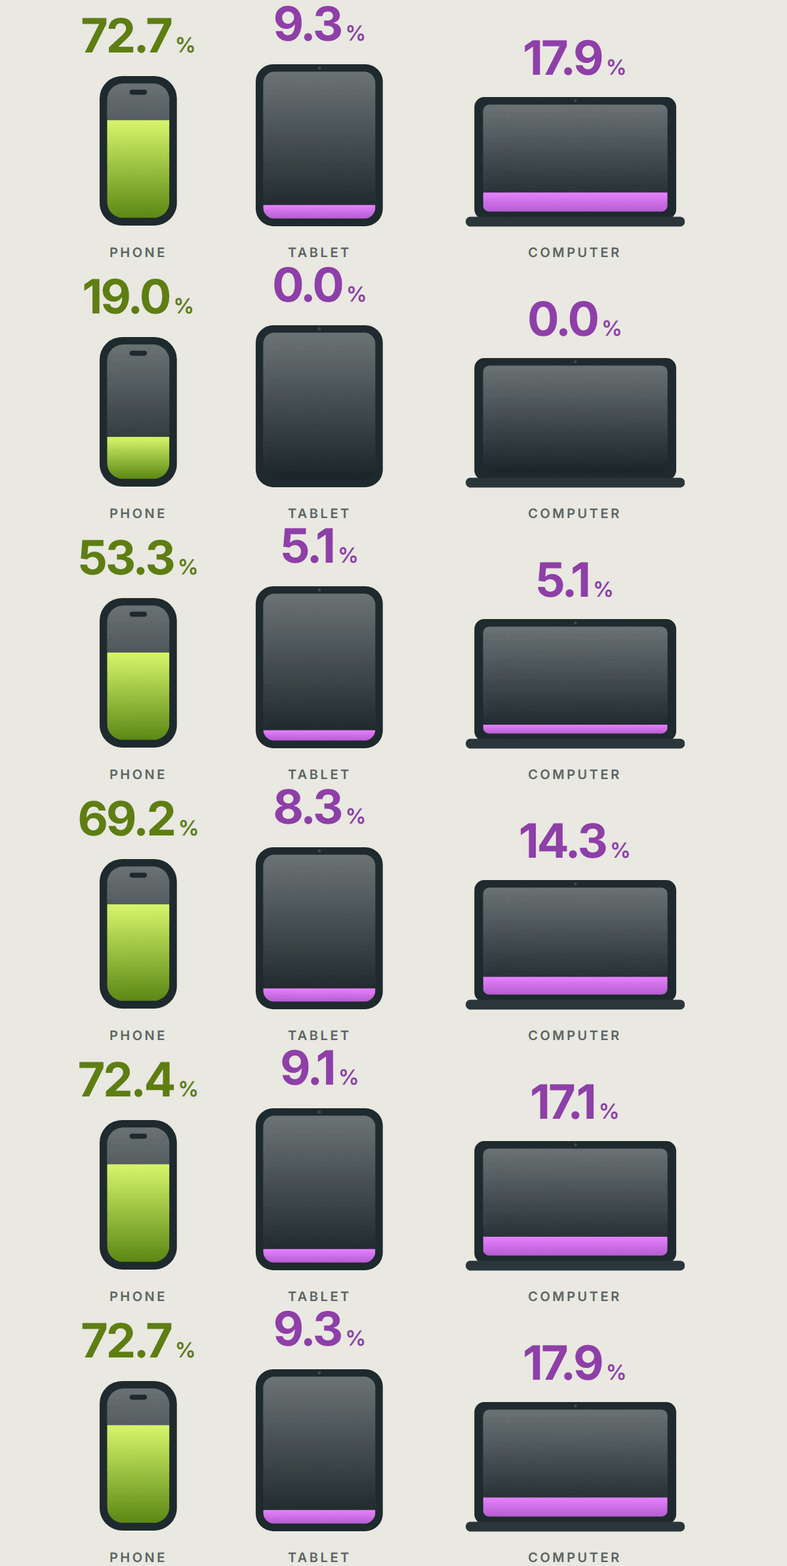
WHAT WE MEASURE This read tracks digital behavior only. Every figure after this, apart from the total viewer estimate, comes from the same 10M-person US panel. SECOND SCREEN BY DEVICE Share of the 3.7M second-screen accounts, by the device they used most. 72.7% PHONE 9.3% TABLET 17.9% COMPUTER MEASURED Streaming of the game on CTV, mobile, tablet, and PC, plus what those accounts did on second screens while it played. SECOND SCREEN Another app or site opened on a phone, tablet, or computer between two events on the stream.
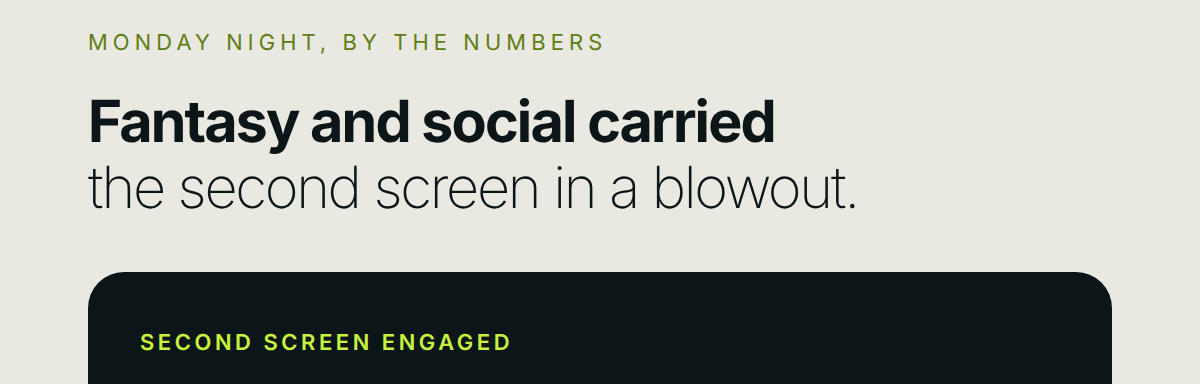
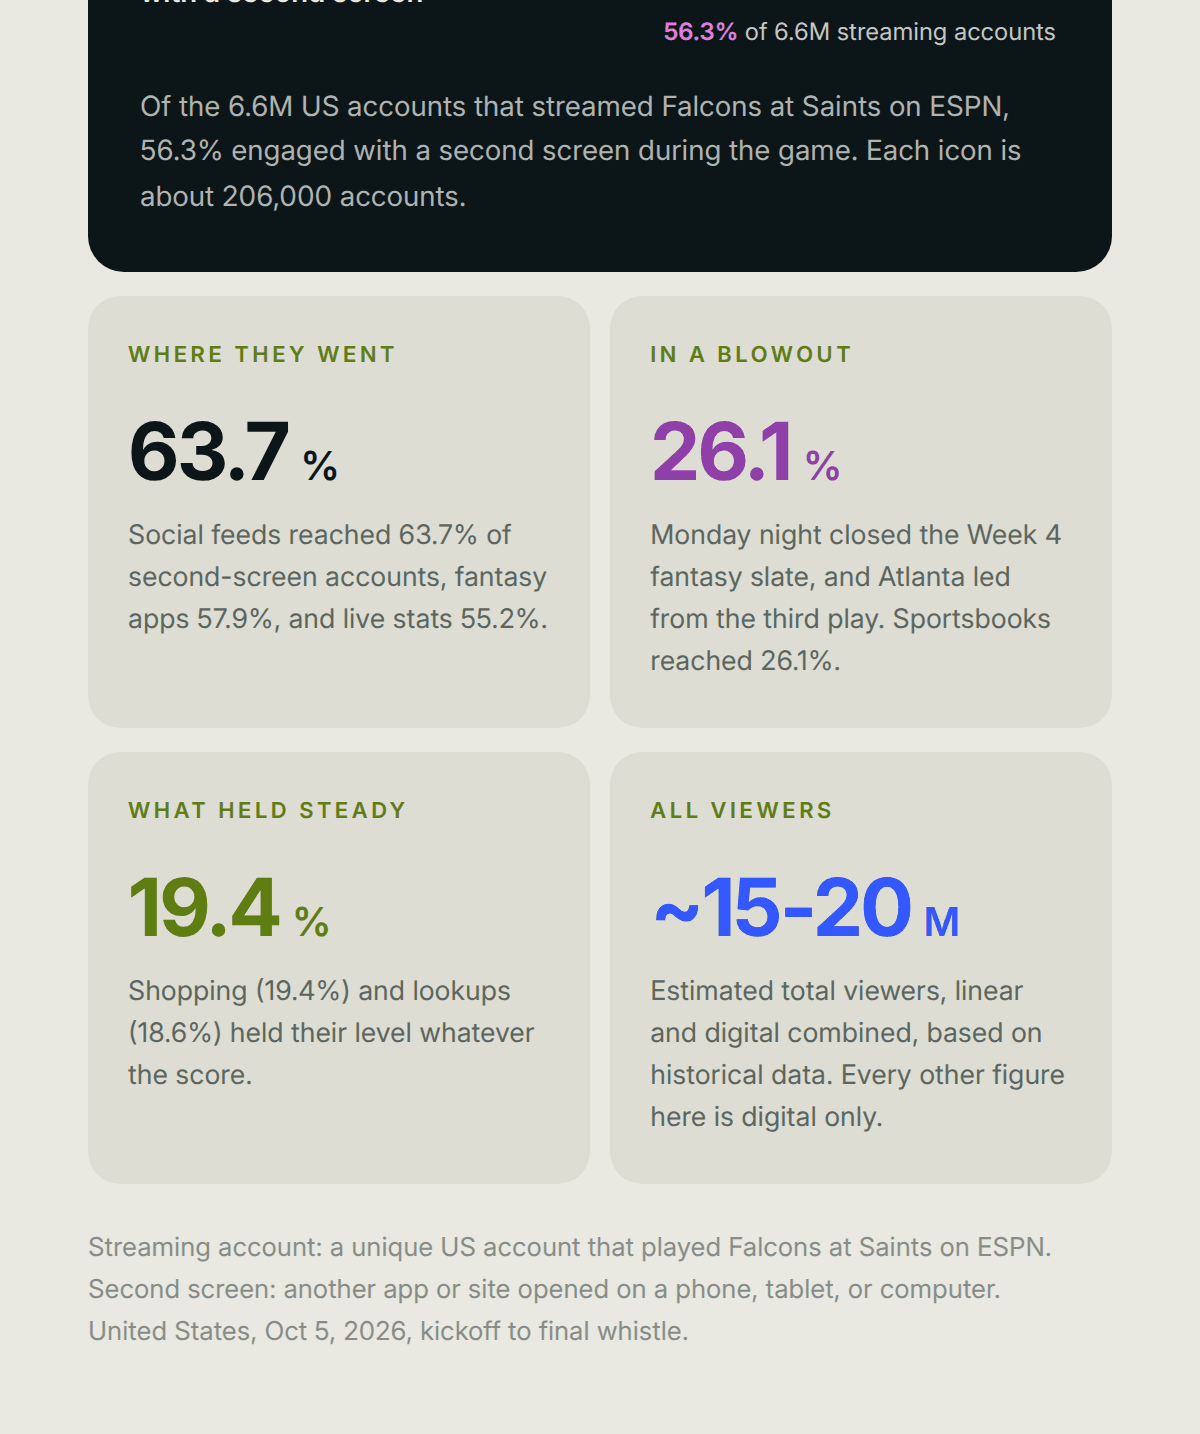
MONDAY NIGHT, BY THE NUMBERS Fantasy and social carried the second screen in a blowout. SECOND SCREEN ENGAGED 3.7M streaming accounts engaged with a second screen 56.3% of 6.6M streaming accounts Of the 6.6M US accounts that streamed Falcons at Saints on ESPN, 56.3% engaged with a second screen during the game. Each icon is about 206,000 accounts. WHERE THEY WENT 63.7% Social feeds reached 63.7% of second-screen accounts, fantasy apps 57.9%, and live stats 55.2%. IN A BLOWOUT 26.1% Monday night closed the Week 4 fantasy slate, and Atlanta led from the third play. Sportsbooks reached 26.1%. WHAT HELD STEADY 19.4% Shopping (19.4%) and lookups (18.6%) held their level whatever the score. ALL VIEWERS ~15-20M Estimated total viewers, linear and digital combined, based on historical data. Every other figure here is digital only. Streaming account: a unique US account that played Falcons at Sai
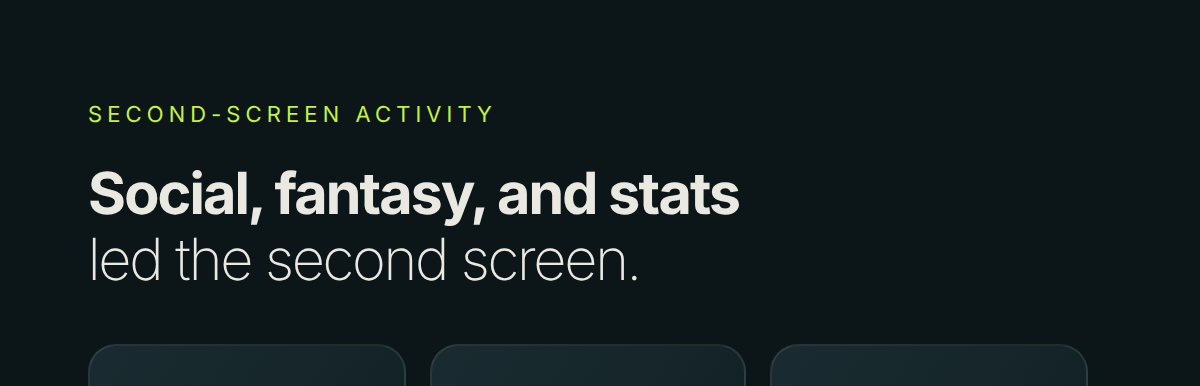
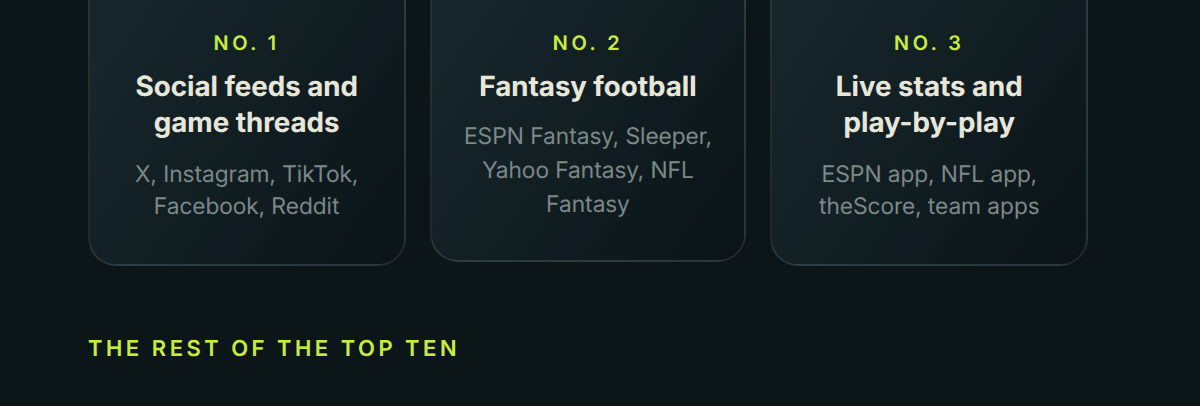
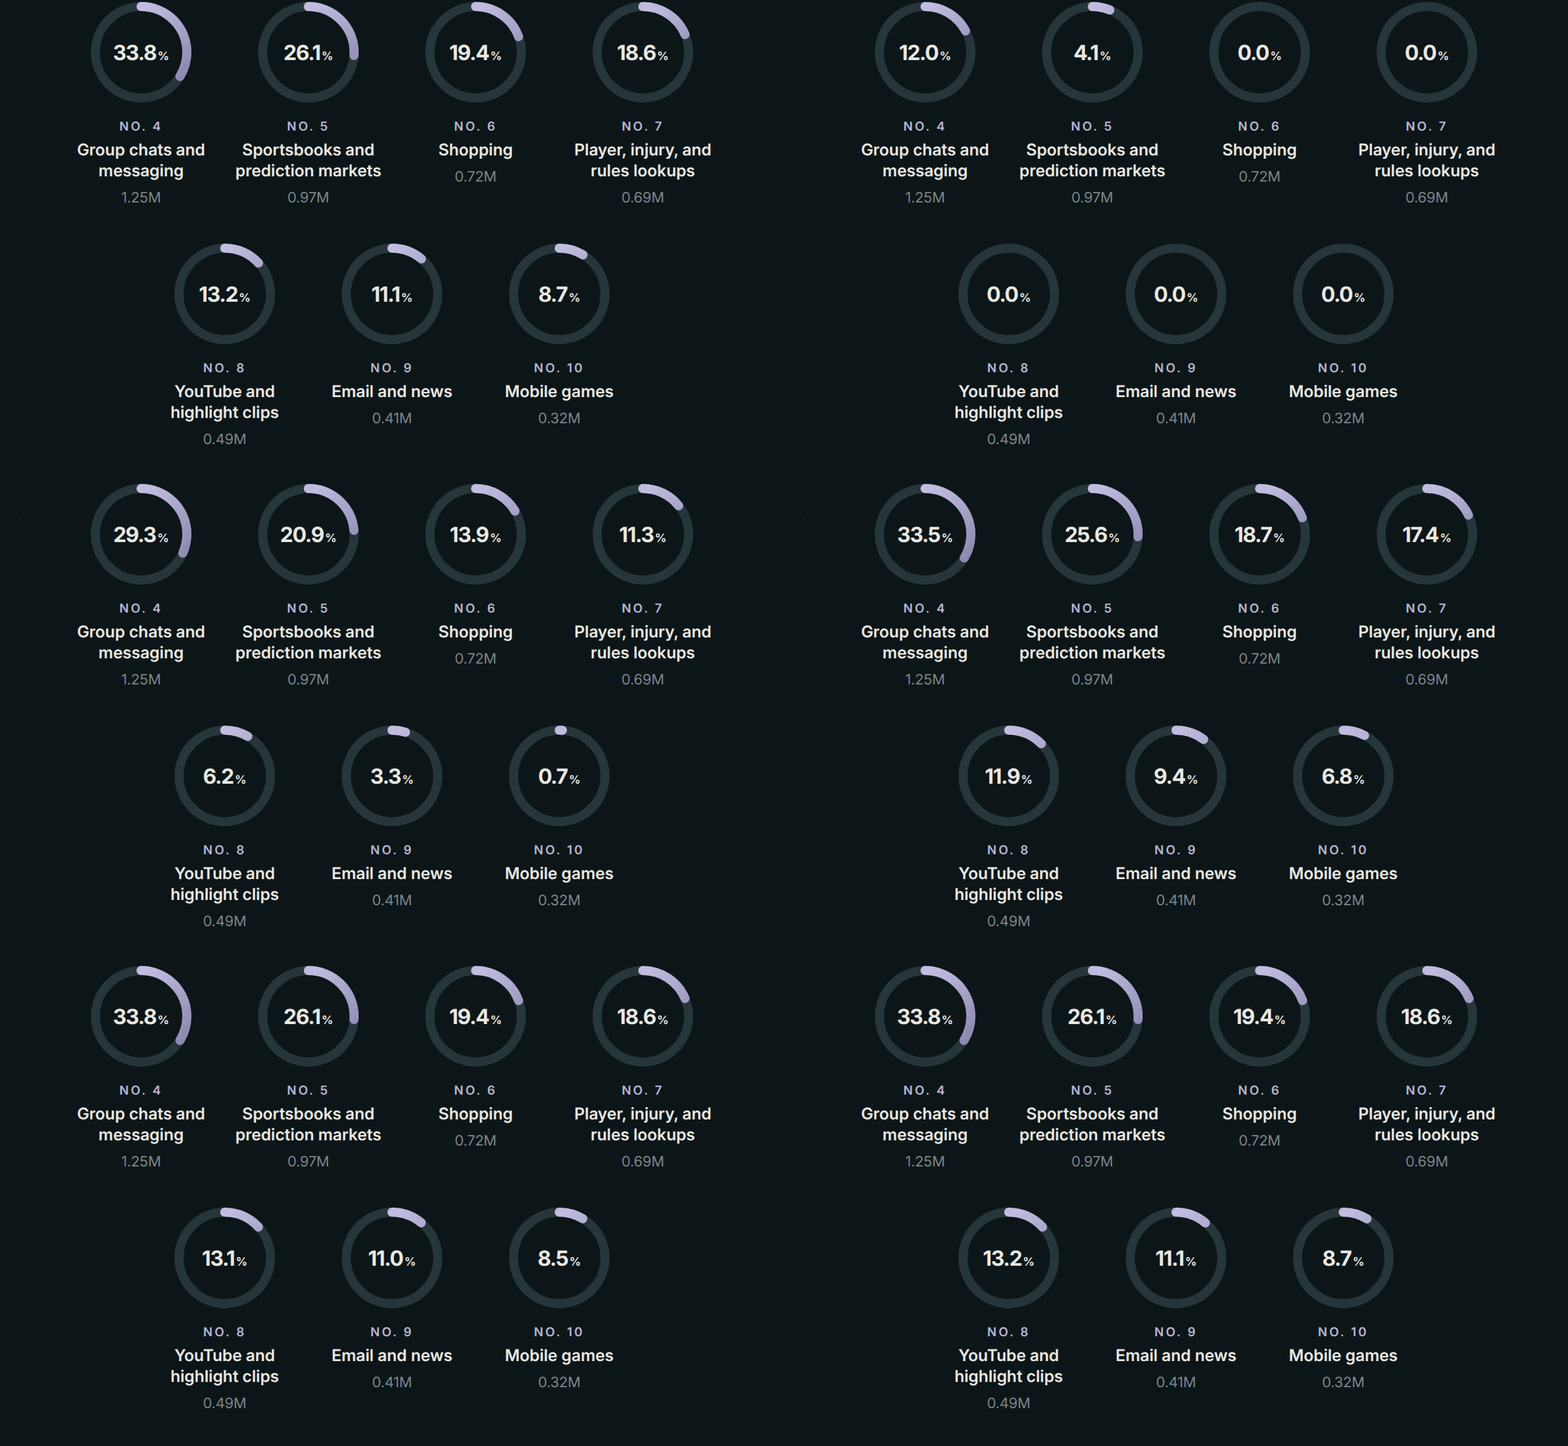
SECOND-SCREEN ACTIVITY Social, fantasy, and stats led the second screen. 63.7% 2.36M NO. 1 Social feeds and game threads X, Instagram, TikTok, Facebook, Reddit 57.9% 2.15M NO. 2 Fantasy football ESPN Fantasy, Sleeper, Yahoo Fantasy, NFL Fantasy 55.2% 2.05M NO. 3 Live stats and play-by-play ESPN app, NFL app, theScore, team apps THE REST OF THE TOP TEN 33.8% NO. 4 Group chats and messaging 1.25M 26.1% NO. 5 Sportsbooks and prediction markets 0.97M 19.4% NO. 6 Shopping 0.72M 18.6% NO. 7 Player, injury, and rules lookups 0.69M 13.2% NO. 8 YouTube and highlight clips 0.49M 11.1% NO. 9 Email and news 0.41M 8.7% NO. 10 Mobile games 0.32M Three of the top five activities were about the game itself: the game thread, fantasy lineups, and live stats. Group chats came fourth at 33.8%, ahead of sportsbooks at 26.1%. Share of the 3.7M second-screen accounts doing each activity during the game. Activi
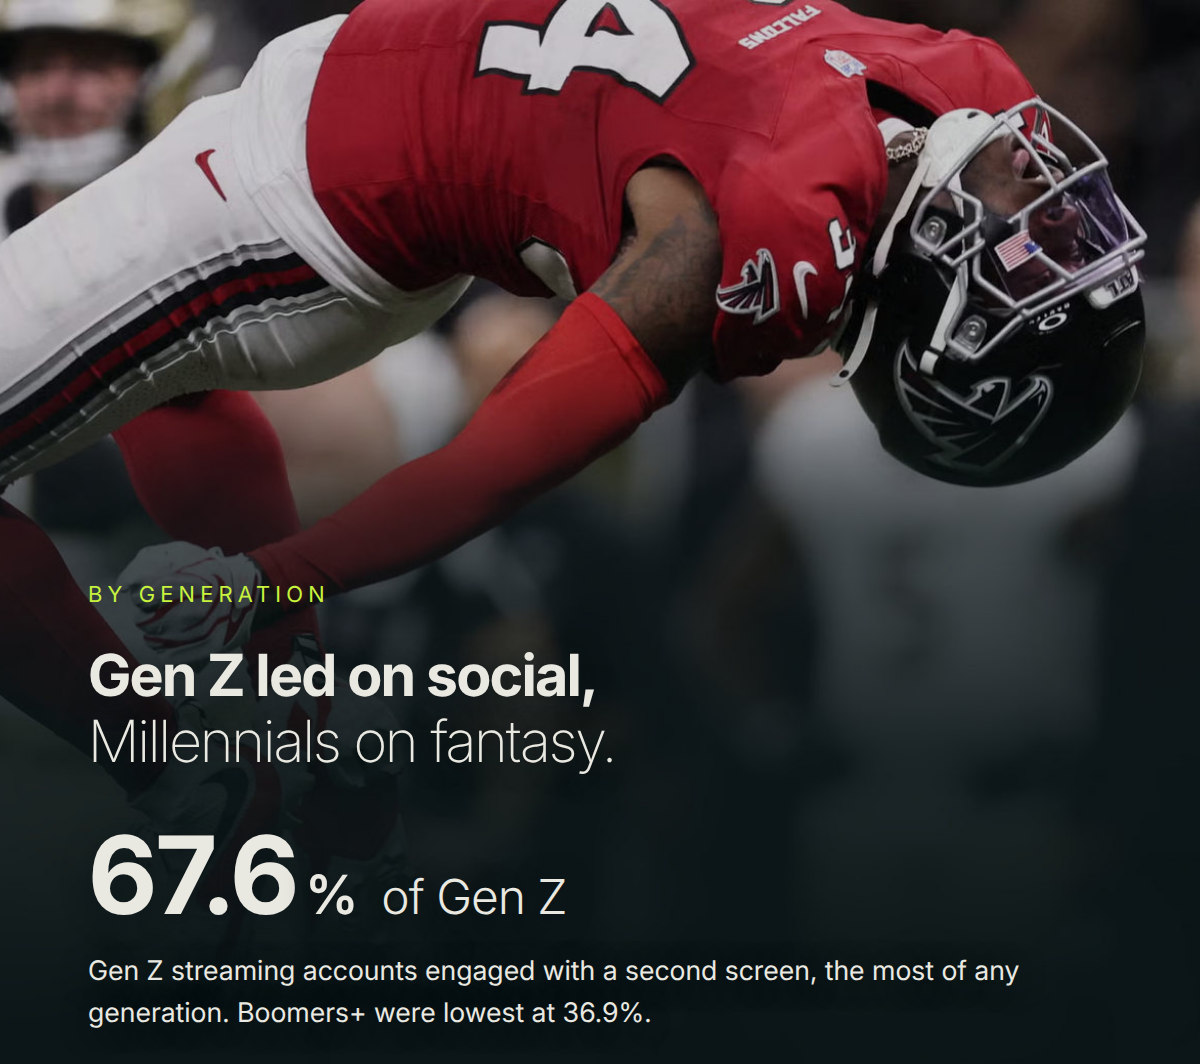
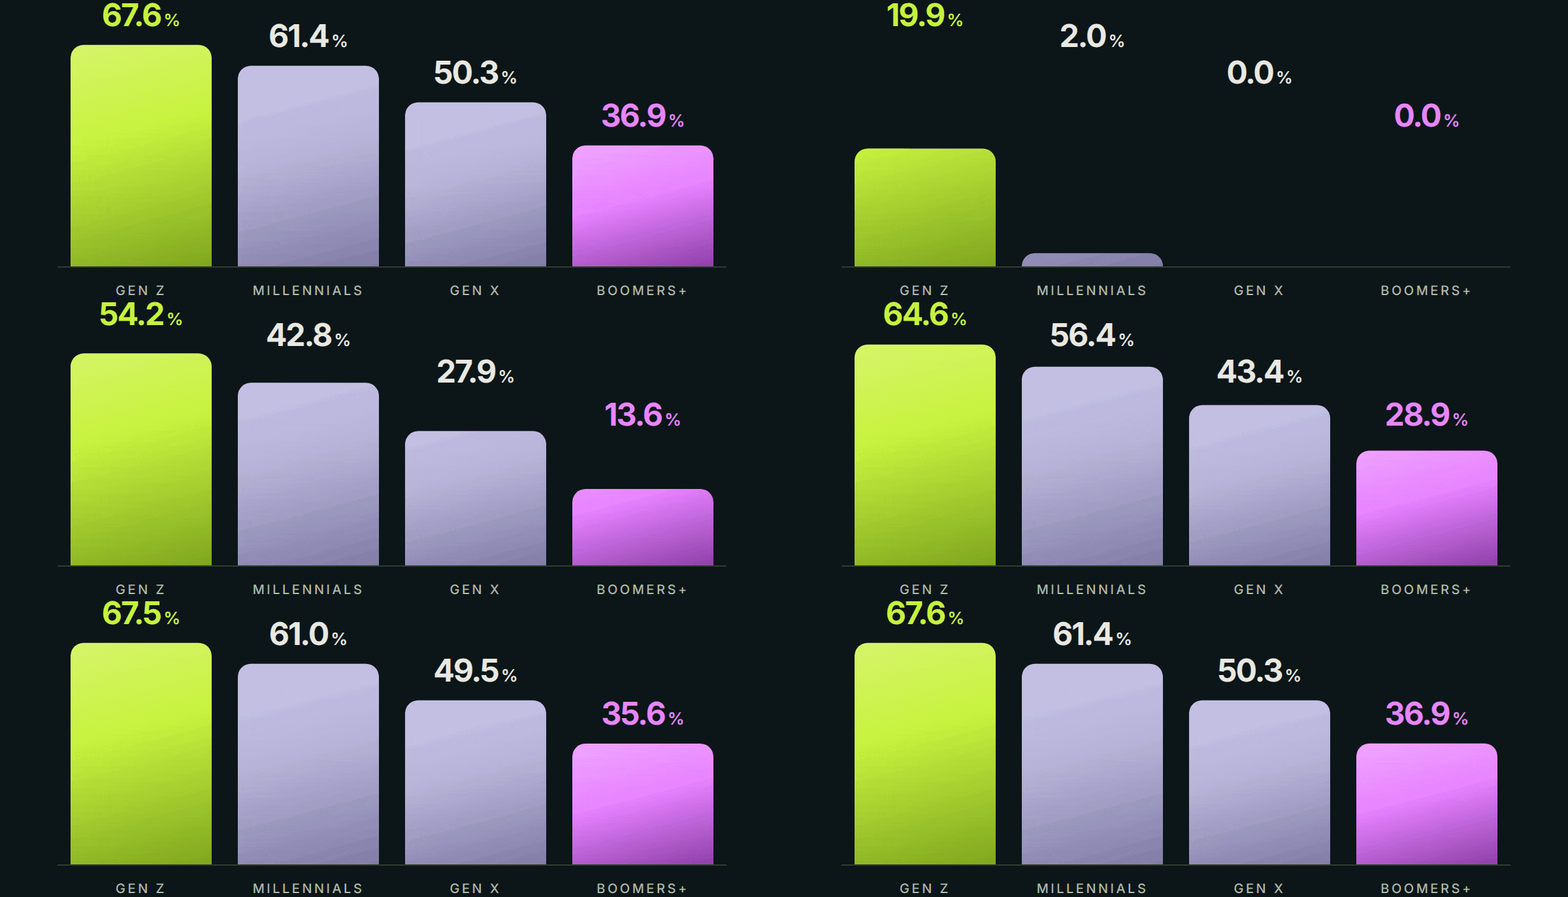
BY GENERATION Gen Z led on social, Millennials on fantasy. 67.6%of Gen Z Gen Z streaming accounts engaged with a second screen, the most of any generation. Boomers+ were lowest at 36.9%.
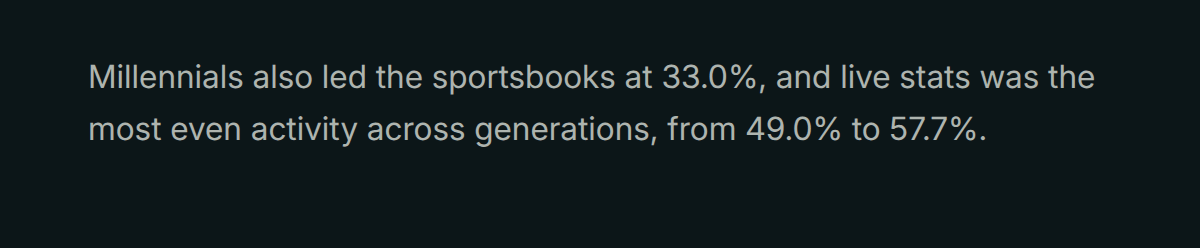
SECOND SCREEN ENGAGED DURING THE GAME Share of all streaming accounts in each generation. 67.6% 61.4% 50.3% 36.9% GEN Z MILLENNIALS GEN X BOOMERS+ Millennials also led the sportsbooks at 33.0%, and live stats was the most even activity across generations, from 49.0% to 57.7%.
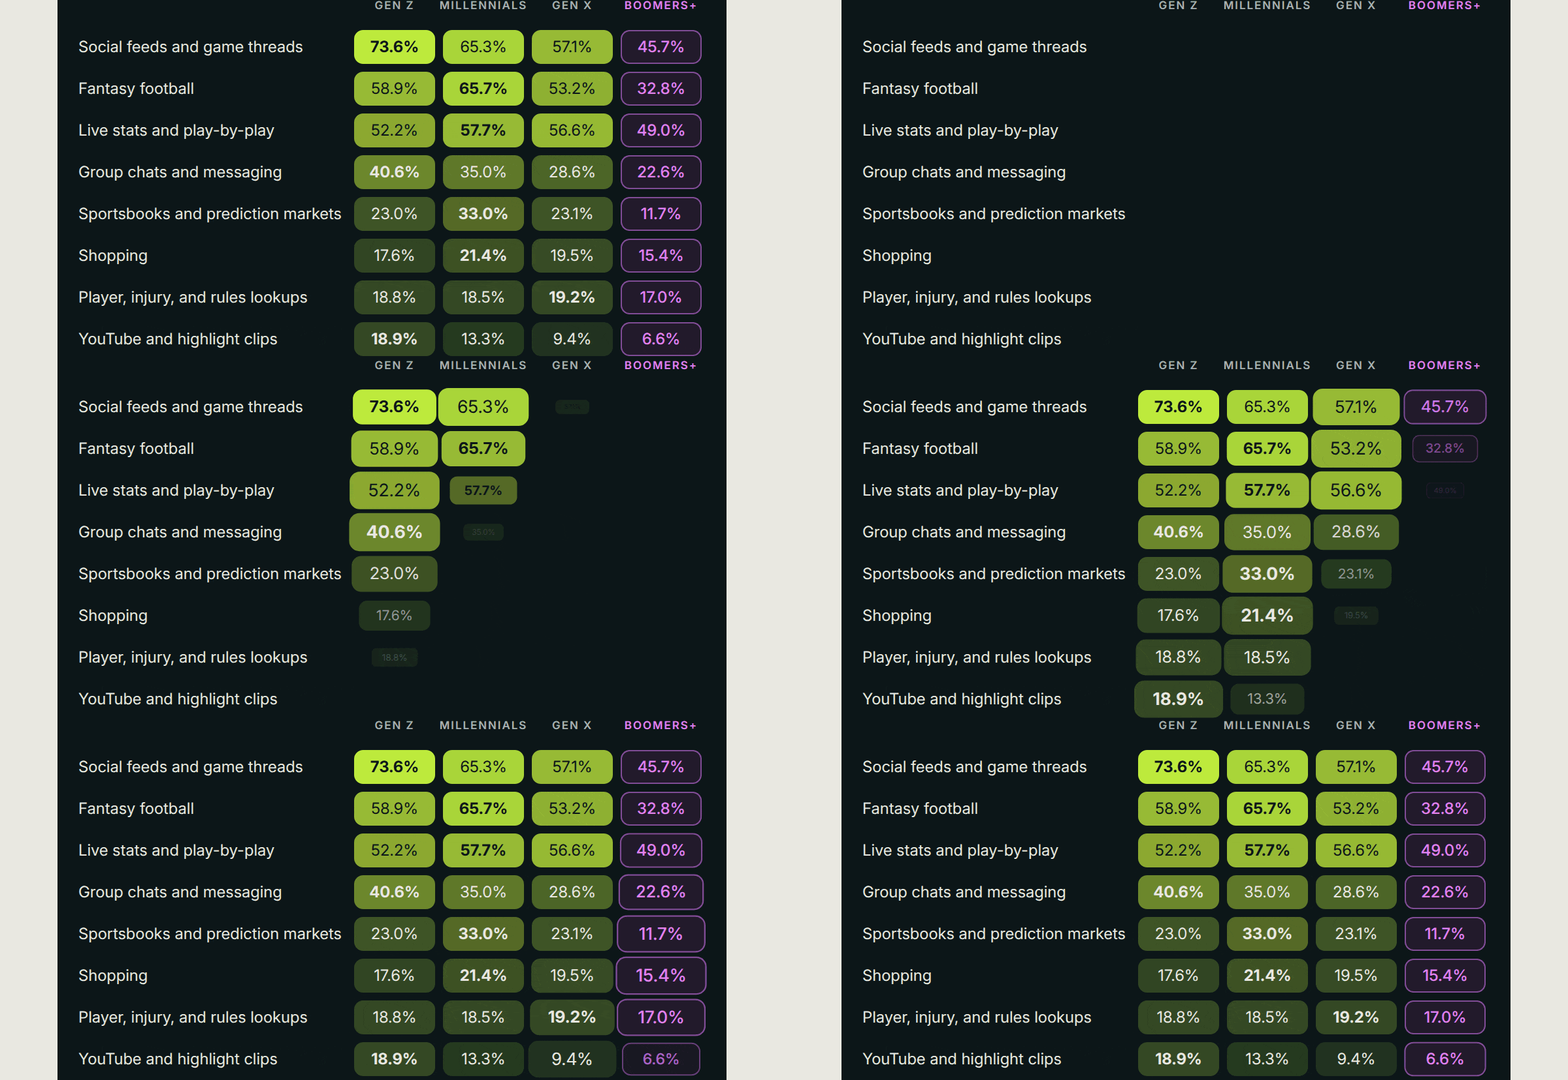
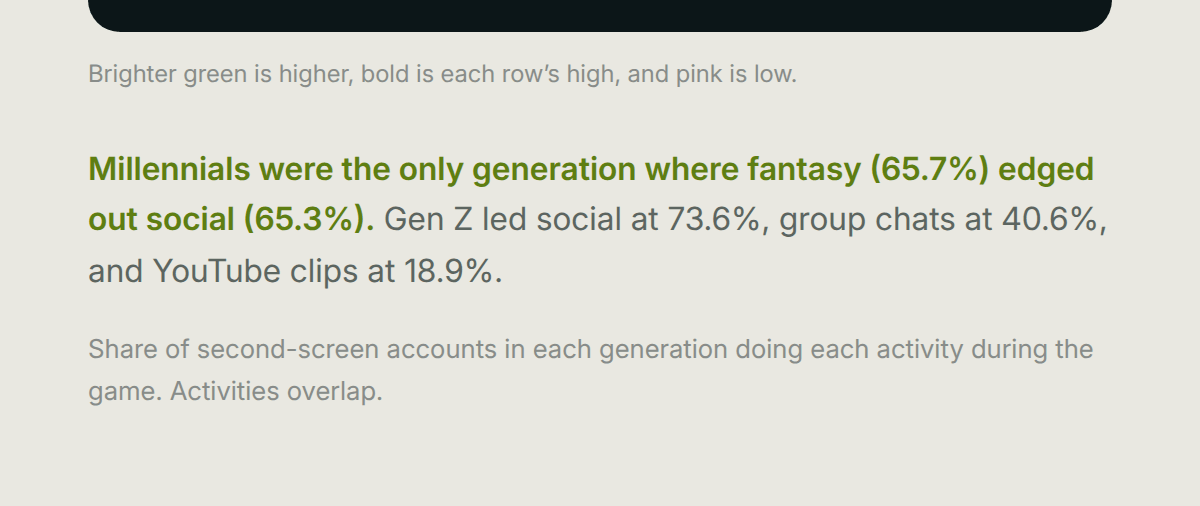
WHAT EACH GENERATION DID Fantasy edged out social only for Millennials. GEN Z MILLENNIALS GEN X BOOMERS+ Social feeds and game threads 73.6% 65.3% 57.1% 45.7% Fantasy football 58.9% 65.7% 53.2% 32.8% Live stats and play-by-play 52.2% 57.7% 56.6% 49.0% Group chats and messaging 40.6% 35.0% 28.6% 22.6% Sportsbooks and prediction markets 23.0% 33.0% 23.1% 11.7% Shopping 17.6% 21.4% 19.5% 15.4% Player, injury, and rules lookups 18.8% 18.5% 19.2% 17.0% YouTube and highlight clips 18.9% 13.3% 9.4% 6.6% Brighter green is higher, bold is each row’s high, and pink is low. Millennials were the only generation where fantasy (65.7%) edged out social (65.3%). Gen Z led social at 73.6%, group chats at 40.6%, and YouTube clips at 18.9%. Share of second-screen accounts in each generation doing each activity during the game. Activities overlap.
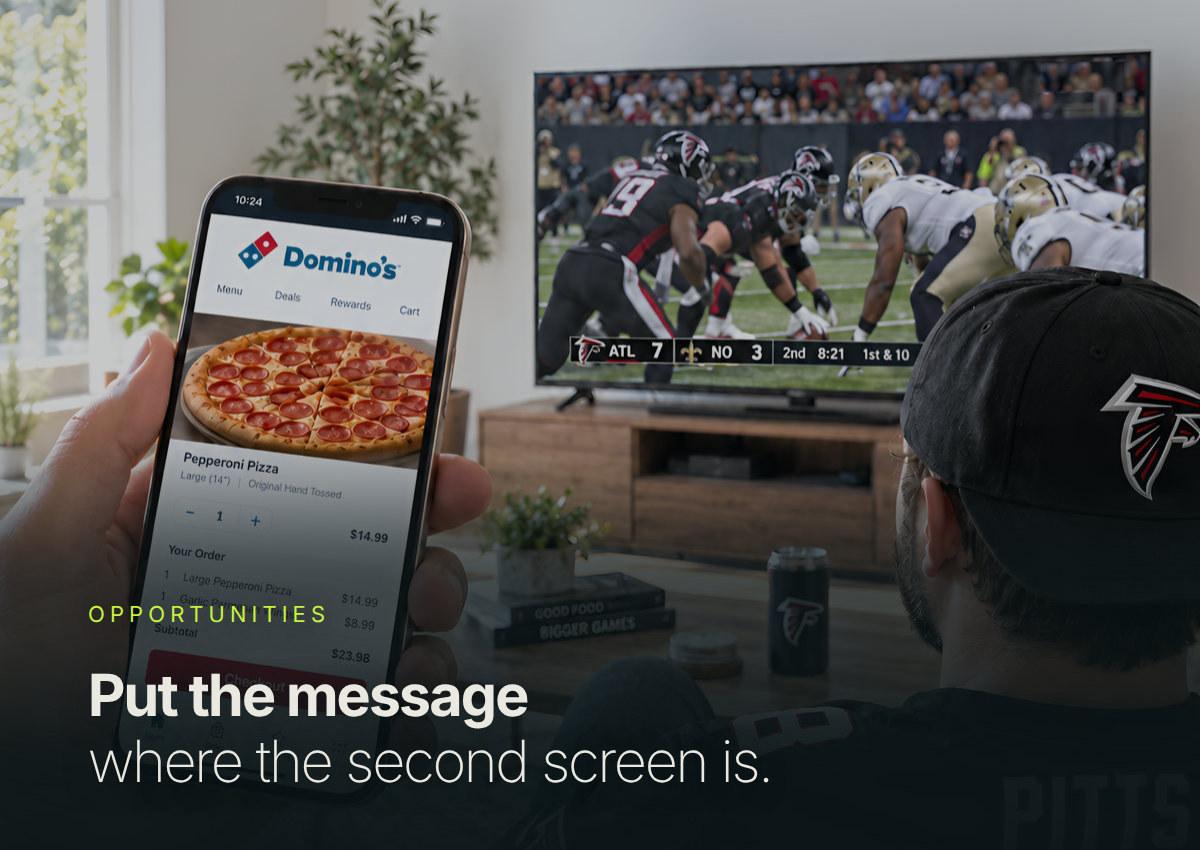
OPPORTUNITIES Put the message where the second screen is.
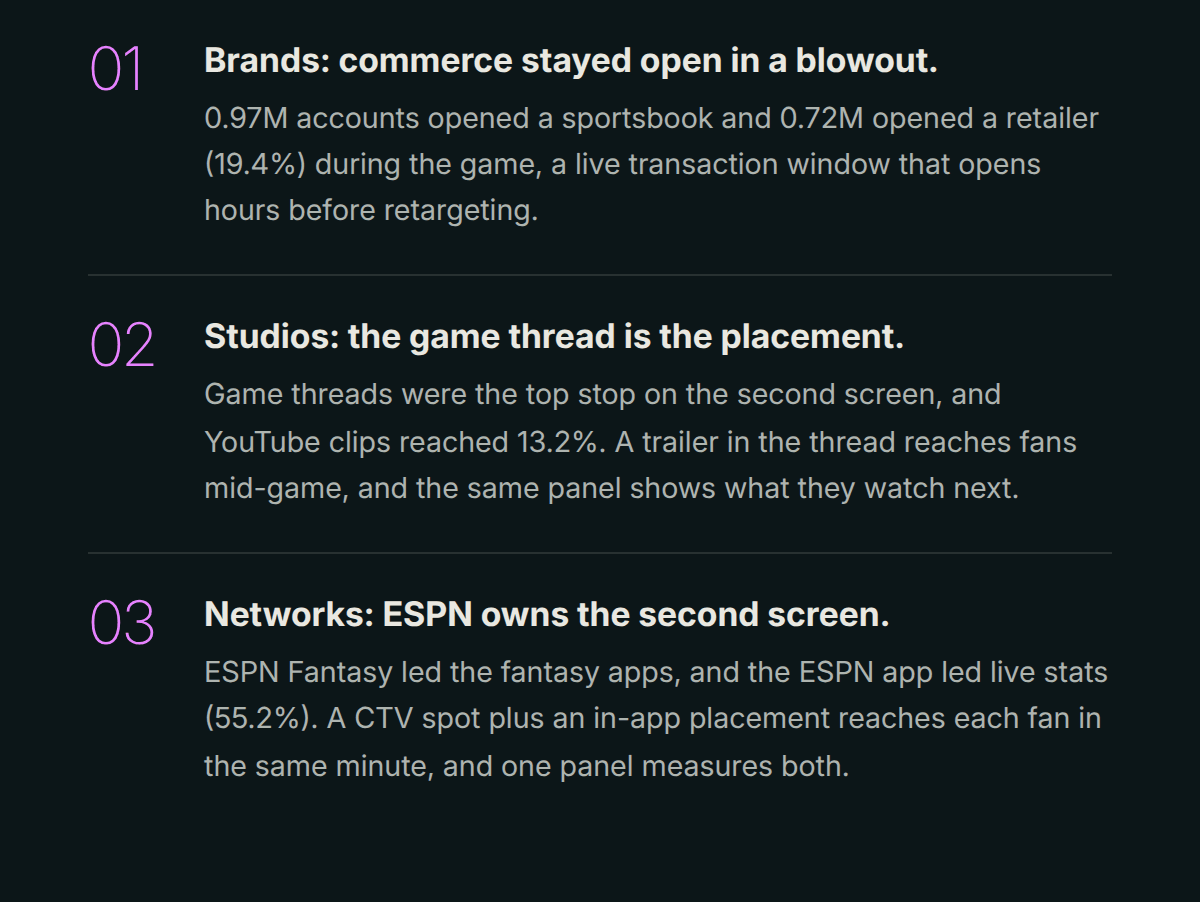
01 Brands: commerce stayed open in a blowout. 0.97M accounts opened a sportsbook and 0.72M opened a retailer (19.4%) during the game, a live transaction window that opens hours before retargeting. 02 Studios: the game thread is the placement. Game threads were the top stop on the second screen, and YouTube clips reached 13.2%. A trailer in the thread reaches fans mid-game, and the same panel shows what they watch next. 03 Networks: ESPN owns the second screen. ESPN Fantasy led the fantasy apps, and the ESPN app led live stats (55.2%). A CTV spot plus an in-app placement reaches each fan in the same minute, and one panel measures both.
Fans in the Superdome
THE FULL READ Know what fans do while the game is on. The stream, the phone, the tablet, and the laptop, resolved to one unique ID per account and read as one journey. Observed and consented. No surveys, no recall. Get the Monday Night Football deck → Know someone who buys media around live sports? Forward this.
BEHAVIORAL INTELLIGENCE ENGINE Digital Journey IQ. Panel of 10M census-matched US consumers, unique US accounts that streamed Falcons at Saints on ESPN, Oct 5, 2026, kickoff to final whistle. Digital signals only; excludes satellite and cable; not comparable to Nielsen ratings. ~15-20M estimated viewers based on historical data. crosswalknyc.com Unsubscribe · Preferences

crosswalknyc.com   Unsubscribe  ·  Preferences